Sponsored Content by Cerba ResearchDec 20 2023Reviewed by Louis Castel
Ki-67 is a key biomarker in oncology, particularly for prostate and breast cancers. Despite this, Ki-67 immunohistochemistry (IHC) analysis has yet to be standardized.
Working groups have issued guidelines for Ki-67 grading in various cancer types, aiming to reduce variability among pathologists.1,2
To assist scoring, digital analysis solutions employing artificial intelligence (AI) or image analysis have recently emerged in the evaluation of Ki-67—offering a robust and rapid alternative.
In this study, the results of Ki-67 scoring conducted with Aiforia Platform® (AI platform) and Halo® (image analysis supervised software) were compared against three independent pathologists (patho) on numerous solid tumors.
Method
One hundred ninety-two tumors of different origins, including prostate and breast, were stained with the CONFIRM anti-Ki-67 clone (30-9) (ROCHE monoclonal primary antibody (IVD)) on the Ventana Benchmark Ultra.
Following the International Ki-67 Working Group (IKWG) recommendations, three pathologists were properly trained. They then scored tissues appropriately.3
Using deep learning, the Aiforia Platform® automatically scored Ki-67 positive tumor cells (Ki-67+) within minutes. To divide the image into tumor, non-tumor, and background, the random forest classifier from the Halo® software was utilized. This was later confirmed by a pathologist. Following cell segmentation, Ki-67+ was evaluated by thresholding.
A matched pairs statistical analysis was then executed using JMP® software.
Table 1. Sample size by solid tumor type from the multiple organ tumor tissue microarray (TMA) (n=192). Source: Cerba Research
| Organ/Tissue |
Histology |
Sample size |
| Stomach |
Adenocarcinoma |
8 |
| Esophagus |
Adenocarcinoma |
8 |
| Colon |
Adenocarcinoma |
8 |
| Liver |
Hepatocellular carcinoma |
8 |
| Pancreas |
Adenocarcinoma |
8 |
| Lung |
Squamous cell carcinoma / Papillary adenocarcinoma / Small cell carcinoma |
8 |
| Cerebrum |
Astrocytoma / Glioblastoma |
8 |
| Spleen |
DLBCL / DBCL |
8 |
| Thyroid gland |
Papillary adenocarcinoma / Follicular carcinoma |
8 |
| Lymph node |
Hodgkin's lymphoma / T-cell lymphoma / Anaplastic large cell lymphoma |
8 |
| Skin |
Squamous cell carcinoma / Dermatofibrosarcoma / Liposarcoma / Malignant melanoma |
32 |
| Breast |
Invasive ductal carcinoma / Invasive lobular carcinoma |
16 |
| Ovary |
High grade serous carcinoma / Disgerminoma / Differentiated sertoli cell tumor |
16 |
| Uterus |
Endometroid adenocarcinoma |
8 |
| Cervix |
Squamous cell carcinoma |
8 |
| Prostate |
Adenocarcinoma |
8 |
| Testis |
Seminoma |
8 |
| Kidney |
Clear cell carcinoma |
8 |
| Bladder |
High grade urothelial carcinoma |
8 |
Workflow
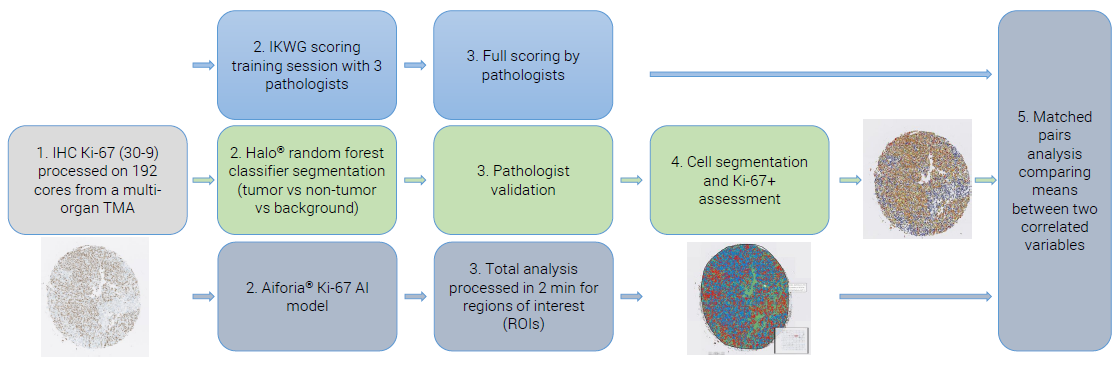
Figure 1. Example of an IHC Ki-67 staining workflow from a lung cancer specimen (papillary adenocarcinoma). Image Credit: Cerba Research
Results: Ki-67 quantification on solid tumors
Due to the absence of tissue and/or pathologists, only 158 out of the 192 cores were analyzed.
Ki-67+ cells were identified in 24.38 % to 28.71 % of the tumor cells on average, depending on the analysis method employed (Table 2).
This study demonstrates a remarkably high consistency in Ki-67 scoring results between the two-image analysis software, Halo® and Aiforia® (r2=0.95), on the solid tumors investigated (n=158).
Despite receiving proper training and following the appropriate guidelines, a weaker correlation was obtained between the pathologists’ scoring (mean r2=0.83)—though it remains within a suitable range (Table 3).
Table 2. Ki-67 quantification results on all solid tumors analyzed (n=158). Source: Cerba Research
| n=158 |
Mean %Ki-67+ |
Mean %Ki-67+ with patho |
SD |
| Aiforia® |
26.30 |
/ |
/ |
| Halo® |
24.38 |
/ |
/ |
| Pathologist A |
27.13 |
26.49 |
1.91 |
| Pathologist B |
23.63 |
| Pathologist C |
28.71 |
Results: Matched pairs analysis of Ki-67 quantification on solid tumors
As highlighted in Table 3 and Figure 2, this study demonstrates a high consistency in Ki-67 scoring results between the two-image analysis software, Halo® and Aiforia® (r2=0.95).
The correlation observed when matching AI with pathologists ranged from fair to strong (r2=0.83/0.82/0.94), while the correlation between Halo® and pathologists scoring was predominantly fair (r2=0.76/0.80/0.89).
The correlation between the three pathologists was weaker (r2=0.78 for B-A, r2=0.86 for C-A, and r2=0.85 for C-B): the weakest link was patho A-Halo (r2=0.76).
Table 3. Matched pairs analysis of Ki-67 quantification results in various solid tumors (n=158). Cell color coding for r2: green >0.90; orange: 0.90 - 0.80; yellow: 0.80 - 0.75. Source: Cerba Research
Matched pairs
analysis (n=158) |
Mean difference
of %Ki-67+ |
p |
SEM |
p |
r2 |
| Halo-Aiforia |
-1.91 |
0.0024 |
0.62 |
0.9988 |
0.95 |
| A-Aiforia |
0.83 |
0.4852 |
1.19 |
0.2426 |
0.83 |
| B-Aiforia |
-2.66 |
0.0193 |
1.13 |
0.9904 |
0.82 |
| C-Aiforia |
2.42 |
0.0007 |
0.70 |
0.0004 |
0.94 |
| A-Halo |
2.75 |
0.0504 |
1.39 |
0.0252 |
0.76 |
| B-Halo |
-0.75 |
0.4971 |
1.10 |
0.7515 |
0.80 |
| C-Halo |
4.33 |
<0.001 |
0.89 |
<0.001 |
0.89 |
| B-A |
-3.5 |
<0.001 |
1.34 |
0.9949 |
0.78 |
| C-A |
1.58 |
0.1587 |
1.12 |
0.0794 |
0.86 |
| C-B |
5.08 |
<0.001 |
1.06 |
<0.001 |
0.85 |
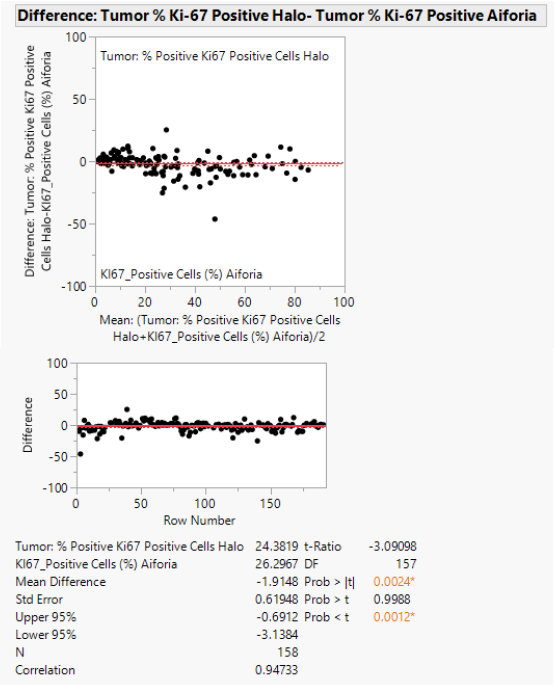
Figure 2. Matched pairs analysis of AI vs Halo® (n=158). Image Credit: Cerba Research
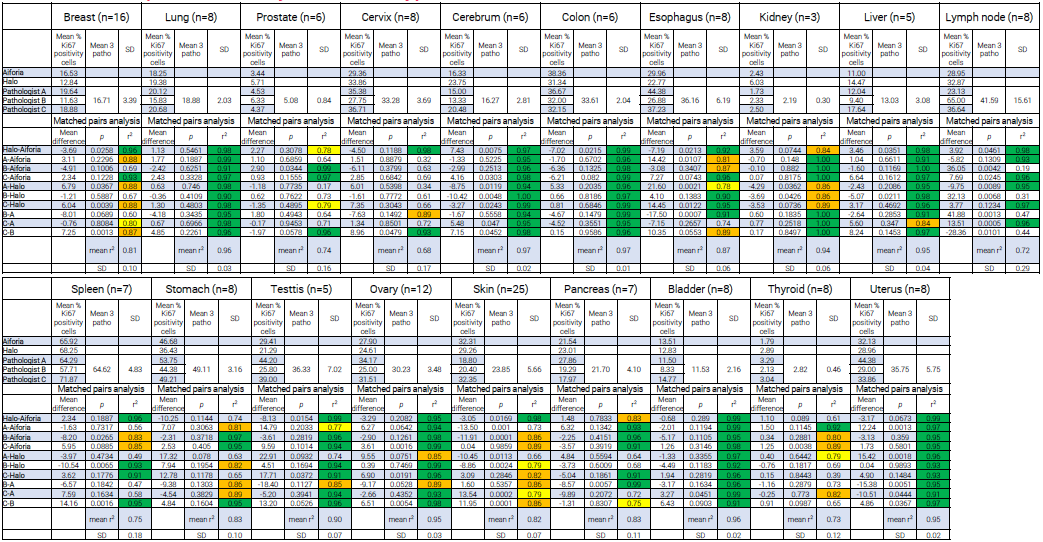
Results: Ki-67 quantification by solid tumor type
For cerebrum, lung, bladder, colon, and uterus, correlations between Aiforia Platform-Halo and inter-pathologist comparisons were generally consistent and high (r2>0.90).
Significant variations between pathologists were observed depending on the organ. In contrast, the scores obtained with the image analysis software remained consistently close.
With lymph node Ki-67 scoring, for example, a 0.98 correlation was identified between Aiforia Platform and Halo, whereas the inter-pathologists’ correlation was only 0.44 (C-B).
It should be noted that, out of the 19 primary tumors studied, only stomach cancer demonstrated correlations under 0.75 between the image analysis software (r2=0.74), with interpathologists’ correlation still high (from 0.86-0.95).
Table 4. Results of Ki-67 quantification by solid tumor type with associated matched pairs analysis. Cell color coding for r2: green >0.90; orange: 0.90 - 0.80; yellow: 0.80 - 0.75. Source: Cerba Research
Conclusion
These results demonstrate that the novel image analysis supervised software, such as Halo®, and AI-based image analysis tools, like Aiforia®, offer valuable support in the image analysis field, allowing a drastic reduction in inter-pathologist variability in the Ki-67 scoring of solid tumors.
References and further reading
- Polley MY et al. An international study to increase concordance in Ki-67 scoring. Mod Pathol. 2015 Jun;28(6):778-86. doi: 10.1038/modpathol.2015.38.
- Nielsen TO et al. Assessment of Ki-67 in Breast Cancer: Updated Recommendations From the International Ki-67 in Breast Cancer Working Group. J Natl Cancer Inst.2021 Jul 1;113(7):808-819. doi: 10.1093/jnci/djaa201.
- Welcome to Ki-67-QC calibrator. URL [http://www.gpec.ubc.ca:8080/tmadb-0.1/calibrator/index].
About Cerba Research
For over 35 years, Cerba Research has been setting the industry standard for exemplary clinical trial conduct. Today, across five continents, with a focus on precision medicine, we are changing the paradigm of the central lab’s role in complex clinical research.
From protocol inception through development and to market, our passionate experts deliver the highest quality specialized and personalized laboratory and diagnostic solutions. Partner with us for the most efficient strategy to actualize your biotech and pharmaceutical products sooner and improve the lives of patients worldwide.
Sponsored Content Policy: News-Medical.net publishes articles and related content that may be derived from sources where we have existing commercial relationships, provided such content adds value to the core editorial ethos of News-Medical.Net which is to educate and inform site visitors interested in medical research, science, medical devices and treatments.